
UK visa refusals by nationality, 2025: data for journalists
The UK Home Office's 2025 visitor visa decisions for the nationalities that apply most, worked out and ready to quote. Every figure comes from the Home Office's entry clearance visa outcomes ↗, published under the Open Government Licence. We update this page when the Home Office publishes new figures; its next release is due on 26 November 2026.
Quotable lines
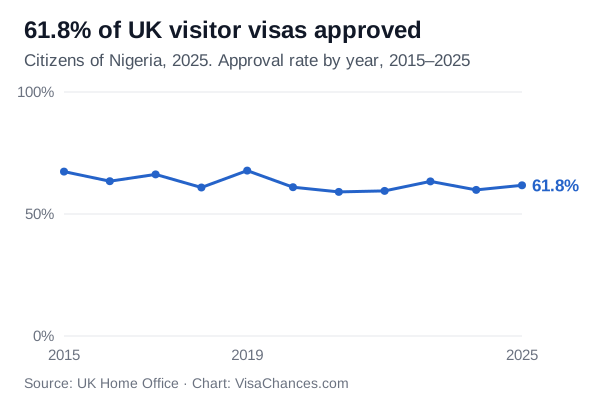
- In 2025, the UK refused 64,941 visitor visa applications from citizens of Nigeria, 38.2% of the 169,839 decisions; the approval rate is 6.0 points lower than in 2019.
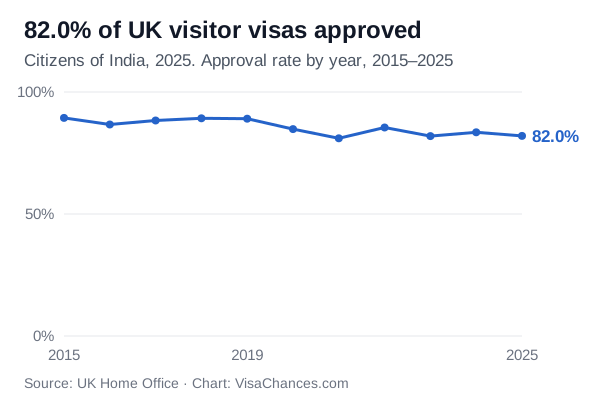
- In 2025, the UK refused 121,777 visitor visa applications from citizens of India, 18.0% of the 677,234 decisions; the approval rate is 7.0 points lower than in 2019.
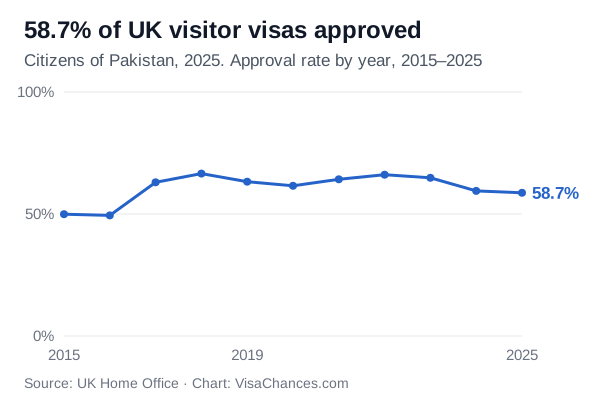
- In 2025, the UK refused 64,618 visitor visa applications from citizens of Pakistan, 41.3% of the 156,359 decisions; the approval rate is 4.6 points lower than in 2019.
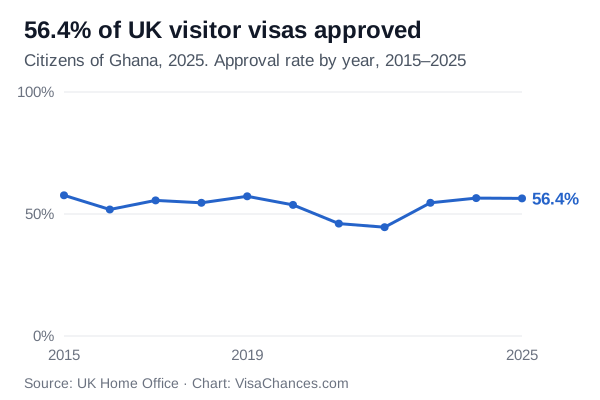
- In 2025, the UK refused 20,329 visitor visa applications from citizens of Ghana, 43.6% of the 46,641 decisions; the approval rate is 0.8 points lower than in 2019.
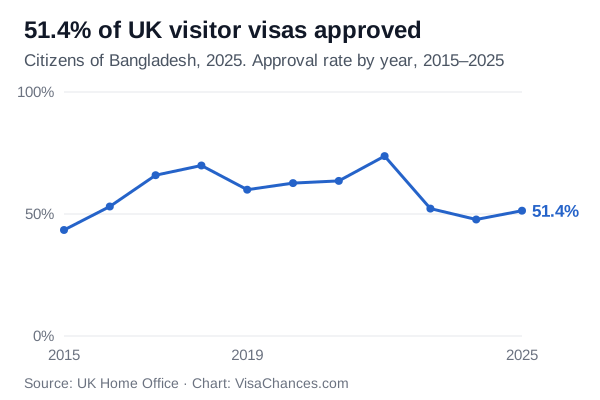
- In 2025, the UK refused 19,594 visitor visa applications from citizens of Bangladesh, 48.6% of the 40,285 decisions; the approval rate is 8.6 points lower than in 2019.
Please cite "VisaChances analysis of UK Home Office data" and link to the nationality's page, so readers can check the figures.
Visitor visas by nationality, 2025
| Country | Approved | Refused |
|---|---|---|
| India | 82.0% | 121,777 |
| China | 91.4% | 44,345 |
| Türkiye | 89.7% | 26,981 |
| Nigeria | 61.8% | 64,941 |
| Pakistan | 58.7% | 64,618 |
| South Africa | 96.2% | 2,984 |
| Thailand | 90.3% | 5,387 |
| Philippines | 86.2% | 7,518 |
| Ukraine | 93.7% | 3,178 |
| Russia | 93.2% | 3,309 |
| Ghana | 56.4% | 20,329 |
| Indonesia | 91.2% | 3,733 |
| Egypt | 76.3% | 9,708 |
| Bangladesh | 51.4% | 19,594 |
| Morocco | 65.4% | 11,837 |
Approved = granted ÷ (granted + refused). Withdrawn and lapsed applications are not decisions and are left out. Nationalities with fewer than 1,000 decisions are not shown. "vs 2019" is the change in the approval rate, in percentage points.
Charts you can embed
Method and downloads
The full table, every nationality and every year, is on the data page as CSV. How we count is on the methodology page. Student, work and family visas are on each nationality's page.